

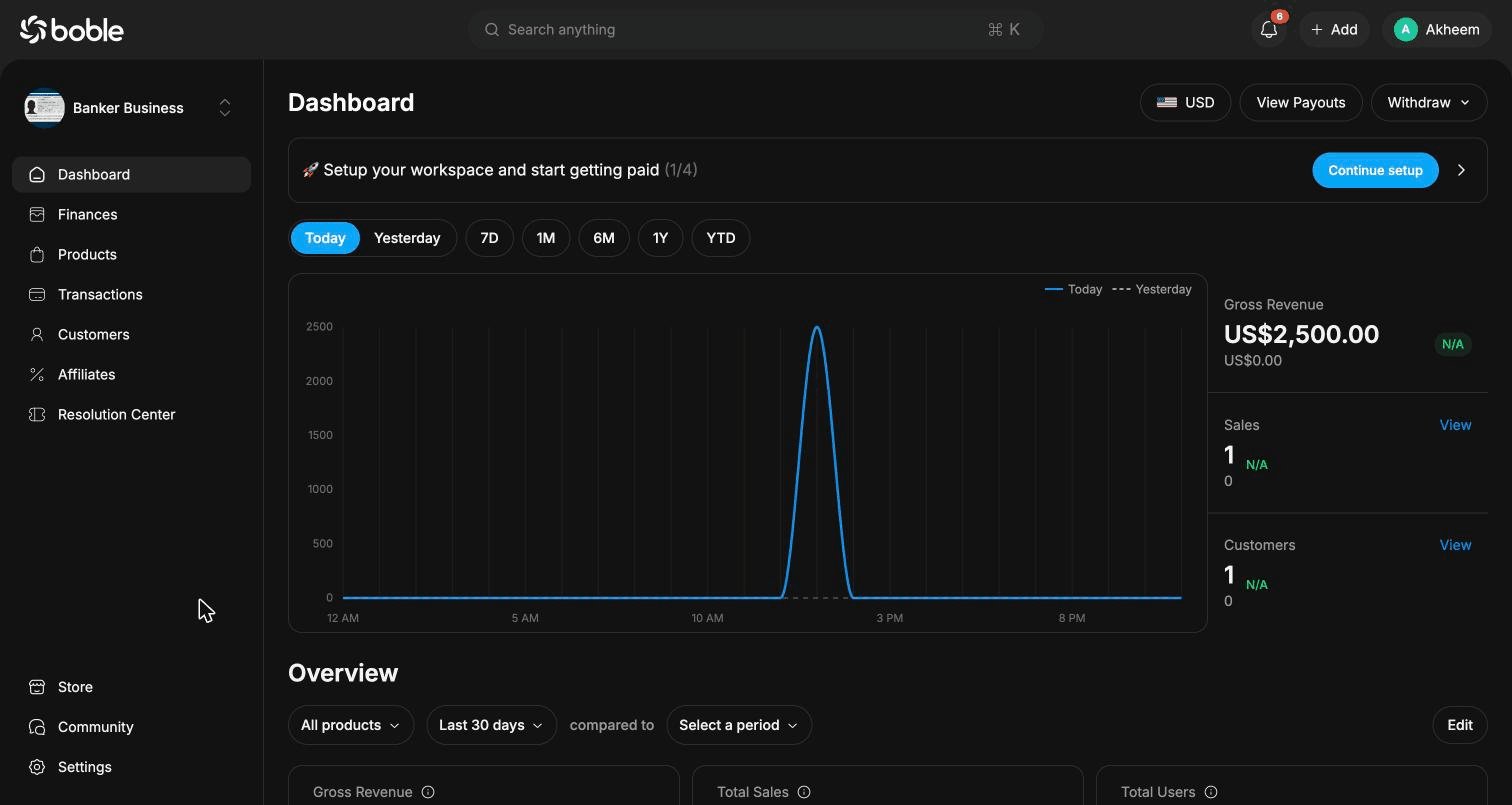
Page layout
Header actions
At the top right of the page you will find:Setup banner
If your workspace is not fully configured, a banner — “Setup your workspace and start getting paid” — shows your progress (e.g. 1/4 steps completed). Click Continue setup to finish the remaining steps.Earnings chart
The main chart compares today’s earnings against yesterday’s, hour by hour. Use the period filter to change the time range:- Today / Yesterday
- 7D — last 7 days
- 1M — last month
- 6M — last 6 months
- 1Y — last year
- YTD — year to date
Overview section
The Overview section displays your key metrics as cards, each with a mini trend chart. You can filter by product (All products by default), change the period (Last 30 days by default), and compare it with another period. Click Edit to customize which cards are displayed.Top Customers by Spend
A ranked list of your top 5 customers by total amount spent, so you can quickly identify your most valuable customers.Sidebar navigation
The left sidebar is available on every page of the admin panel:- Dashboard — this page
- Finances — balance, payouts, and financial reports
- Products — create and manage your products
- Transactions — payment history
- Customers — customer list and details
- Affiliates — affiliate program management
- Resolution Center — disputes and customer claims
- Store — your public storefront settings
- Community — community features
- Settings — workspace configuration
⌘K) lets you find anything in the admin panel.